Image


Fast, affordable Internet access for all.
In the quest to unlock billions of dollars in broadband infrastructure money, Louisiana and Virginia have outpaced all other states in the speed with which they are dispatching the BEAD program’s requirements. Louisiana was the first to complete the challenge process and is still the only state to have received approval for Volume 2 of its initial proposal. Virginia, meanwhile, has completed their challenge process but now appears locked in a battle with the NTIA over the low-cost plan parameters they intend to set.
Information is trickling out about the challenge process in both states. We know that Louisiana received a reported 110,00 challenges and Virginia even more, counting 130,000 before the challenge window had even closed. It will be interesting to learn about challengers’ experience with the process, particularly for those nonprofits and local governments which have less experience with broadband mapping and data reporting. In the meantime, the states’ mandatory challenge process disclosures can give us some preliminary insight into how the challenge process is being used.
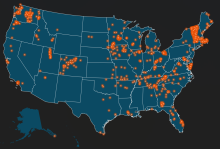
Two Maps Show Current Status of Challenge Process
NTIA guidance stipulated some transparency requirements for the post-challenge process that we are now beginning to see play out. Louisiana's and Virginia’s maps now show data on the challenges made during the process - who challenged the designation, what type of challenge they made, and, if available, the results of the adjudication process. (NTIA guidance requires “a summary of the challenge” and “a summary of the rebuttal,” which suggests slightly more detail than the maps provide.)
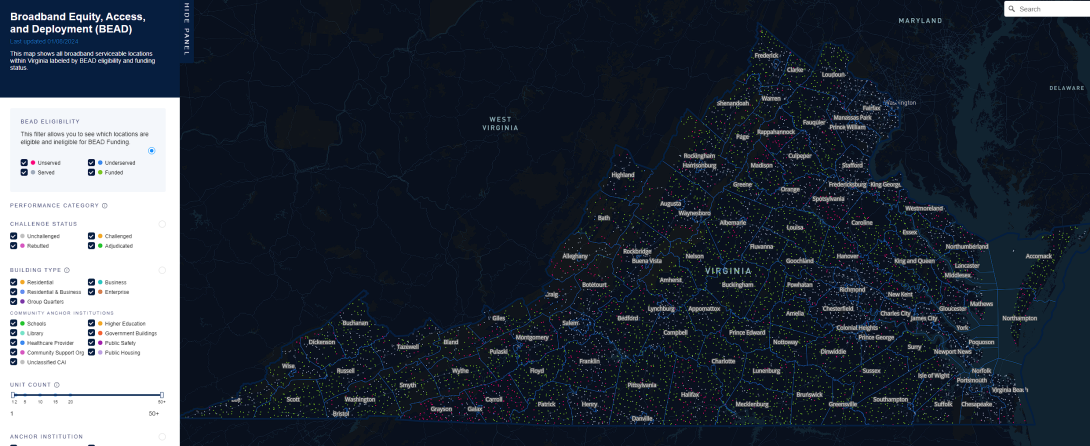
Interested residents and community organizations in those states can use the Ready.net product to filter locations by BEAD eligibility, location type (home, business, community anchor institution and type, etc.), whether there is an active, rebutted, or adjudicated challenge, and past funding programs, technology types, and service providers. Visibility into this process as it proceeds can be reassuring to residents and broadband advocates by showing in relatively clear ways how the process is shaping up at the state level while also illuminating the broadband landscape more generally.
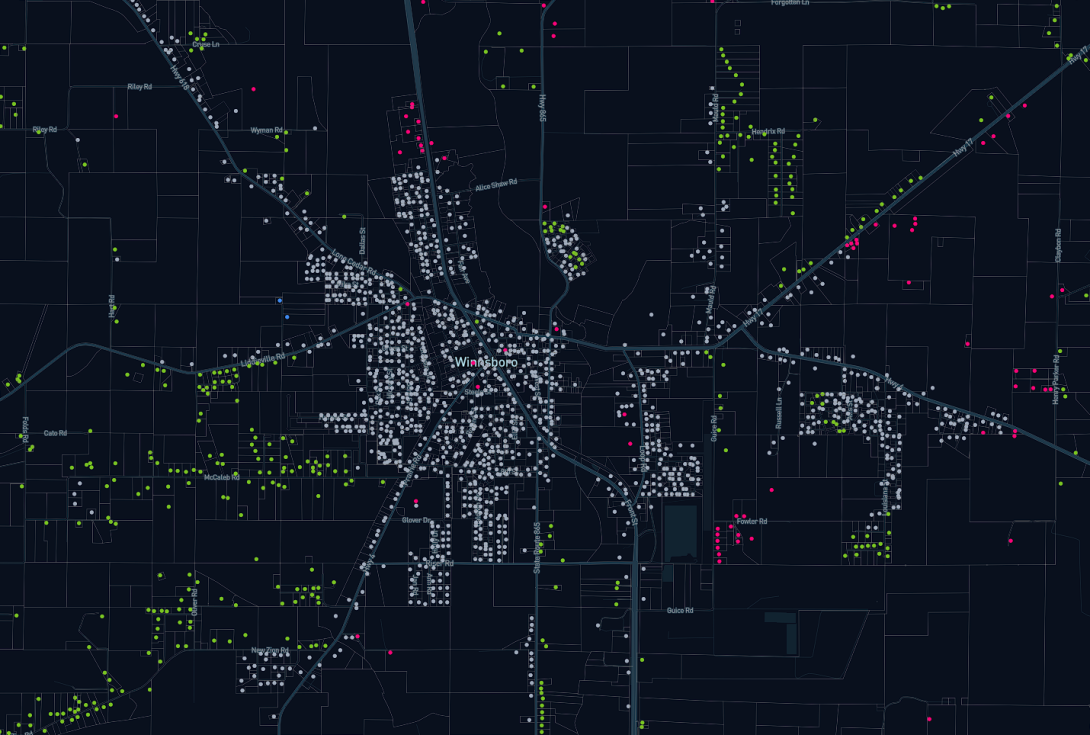
At the same time, outliers and trouble areas can also provide insight into state conditions. One can identify, for instance, where providers have sought to change the status of a location to “served” on the basis of their planned future deployment, only to be told they provided insufficient evidence for such a claim. An example of this is around Winnsboro, Louisiana (see image below), where ISP US WiFi LLC looks to have attempted to claim planned service for hundreds of locations to prevent BEAD funding from flowing there, only to have had that challenge rejected. But citizen-submitted challenge data is available too - though it doesn’t look like users can filter the maps to show only those locations, which would be helpful.
At the same time, the experience of these bellwether states offers a first window for analysts and BEAD observers into how the challenge process more broadly may proceed. Both states opted for a Ready.net mapping product. Several other competitors are working to develop challenge portal software, but Ready is the first out of the gate. It may be useful for analysts, or future challengers in other states, to see this interface in action.
What Information Will, or Will Not, Come Next?
These maps are not the end of the story for challenge process transparency, however. Though the maps might be more accessible to the layperson or city official interested in visualizing challenges in their own neighborhoods, for instance, the format of this data does not allow for systematic analysis of the challenge process. Did challenges come overwhelmingly from telecoms? What type of challenges were most common? Which challenges were more likely to be upheld?
These and many other questions can help inform our understanding of the BEAD challenge process design and execution to prevent abuse, encourage practical solutions to the many edge and corner cases out there, and ensure public funds get used efficiently without slowing down deployment unnecessarily.
To that end, Virginia recently posted a downloadable file to their BEAD process webpage listing all challenges received during the process. This may be an extremely useful tool for researchers and allows for filtering or sorting by challenger, by adjudication status (last updated January 3), or by challenged ISP listed by FRN. The list includes over 260,000 challenges, more than twice the figure that was quoted in a call with NTIA late in the process, and a staggering number considering that the state was purportedly anticipating in the ballpark of 1,000 challenges. We look forward to a deeper analysis of this data.
On the other hand, other states who have announced the use of Ready.net products have not or are not (Kansas for instance) making their maps publicly accessible. In those cases, it remains unclear how they will meet NTIA’s transparency requirements in their challenge process, or how the public will know whether their addresses have been correctly coded.
Virginia’s and Louisiana’s maps, and Virginia’s data file, look to be a good first step in making transparent how the BEAD challenge process is shaping out, but, as with all large and complex datasets, the limits are quickly apparent. If we want to truly hew to the spirit of the NTIA rules, we would prefer that states grant the public a level of access to the data that will allow us to find problem ISPs and see how and where the process is being gamed to waste funds or prevent competition. Otherwise, we’ll be looking back after all the funds have been spent and those households will have remained left on the wrong side of the digital divide.